Data Storytelling
Article 19 explores the art of data visualization and storytelling

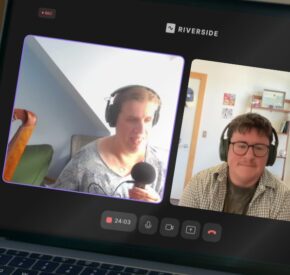
In this bonus episode of Article 19, Marty sits down with Emma Barker, a talented data analyst at Tamman. They dive into the world of data visualization and storytelling, exploring how to transform complex data into engaging and informative insights. Emma shares her passion for making data accessible to everyone and they discuss the importance of critical thinking and data literacy in today’s data-driven world. Plus, they chat about the power of community and collaboration, especially in remote work environments.
Meet our guests:
- Emma Barker is Tamman’s VP of Accessibility Services and a data analyst who loves diving deep into numbers and uncovering hidden stories. She is passionate about making data accessible to everyone, transforming complex datasets into clear and engaging visualizations.
Listen to more Article 19 Podcast Episodes
Full Transcript
Access PDF Transcript
Marty Molloy:
Hello, my name is Marty Molloy, welcome to another mini podcast for Article 19. I am here today with the amazing, Emma Barker. And she is amazing. She is a colleague of mine here at Tamman, who is in a role that is truly unique. And she’s the kind of person that whatever she does, and whenever she gives the information, it always seems to make things better. And I love working with someone who contributes so much so fearlessly and tries to make the world around her a better place, wherever she is. So Emma, welcome to your mini pod. Can you start off by telling us a little bit about what your role is at Tamman? And then we’ll get into some of the meat of the questions.
Emma Barker:
Great. Absolutely. So thanks for having me. Happy to be here. I’m Emma Barker. And I am a data analyst. So I focus a lot on data analysis and a lot of reporting. So doing data visualizations, trying to really investigate what questions we’re trying to answer and to present those answers in an effective and clear ways. Because I know, not everyone loves data as much as I do. So a big part of it is doing all of the data analysis, the back end, and then presenting it in a way that is accessible to everyone.
Marty Molloy:
So I want to get to the that storytelling element, because you really are a storyteller. And I’ve heard and read articles that talk about the power of visualizations, right? I mean, they have literally changed the world. I’m thinking most recently about Tim Harford was talking about data visualization from Florence Nightingale, back in the 19th century, and just you know, absolutely changing healthcare space in England. Do you think of yourself as a storyteller? And when you’re compiling this, these this data and reports, do you do have a process or a way of thinking about that?
Emma Barker:
Yeah, absolutely. I think that anyone who is trying to convey data in a clear and easy to understand and remember, way has to be a data storyteller. And that’s partially because human brains are have evolved to remember stories, there are lots of really interesting studies about it. That, you know, the difference between if I tell you, Oh, the number was 12, verses, engaging you in a story at where I, in the story tell you the number 12, and why it’s important and how it relates to you, you will remember the second version for much longer, no doubt. So I think that you have to be a storyteller, to work with data. And I think it can be easy in the day to day job to forget that in gotta gotta turn out a report. But the the results that are impactful, and that people remember and are grateful for are the ones where you have really considered the storytelling element of the data.
Marty Molloy:
Yeah, that’s wonderful. So thinking about people receiving that story, and receiving the data, you know, at Tamman. And certainly with Article 19, we talk a lot about access to information being a human right. And in no other spaces, can that information be in its most authentic and raw form? And then when you’re looking at data, when something is being presented visually? Do you see yourself as part of that at Tamman and having some, you know, responsibility towards digital accessibility when it comes to putting together your data and your visualizations?
Emma Barker:
Yeah, absolutely. And I think, you know, earlier in my career, as you know, a data analyst, accessibility and data accessibility really wasn’t even on my radar at first. But the more you learn about good data visualization, the more you’re automatically going to learn about data accessibility. And if you think about it, if I spend hours making a beautiful chart, but the data isn’t accessible, then it’s useless for people who can’t access the data. So I think really, the fundamental has to be the data accessibility. And, you know, that can be as simple as looking at a bar chart that you made in a couple clicks in Excel and realizing that the different series that you have on the bar chart are only differentiated by color. And if someone has colorblindness then they wouldn’t be able to tell the difference between the two things that you are clearly trying to convey. Information about, you wouldn’t have the two things on the chart if you weren’t trying to point something out about it. So as simple as adding shading to one, right so there’s a fill pattern on one bar that is different from the other one, or changing it to a line chart and using different shaped points on the different lines can really make a big difference in terms of instantly you made that chart more accessible for more people.
Marty Molloy:
Yeah, yeah. That’s, that’s brilliant. So you’re a researcher by trade, and I think probably also just who you are, you’re someone who really seeks out a lot of complicated information. Um, you know have you ever run across data, not necessarily even at Tamman. But have you ever run across data that you found to be just too difficult when you’re looking at it from a deep research standpoint, to get it into a place where someone more like me could actually consume and use that data? And when that happens, what are coping mechanisms with that?
Emma Barker:
Yeah, I forget where I heard this once. But it has stuck with me ever since. And it was the idea that if you cannot explain it simply, you don’t understand it well enough. And I think that’s the truth with with data, because it data can get overwhelming because you, you know, have access at, you know, a click of a button to so much data out in the world. And it can be overwhelming. And I think that, you know, when you’re faced with that, you have to go back, there’s Bill Shander has some excellent videos that I think I found through LinkedIn, LinkedIn learning. I really recommend his work. It’s all about kind of data storytelling. And he has these three acronyms that I think really answer this question, which is right, know what you want to say. I think KWYRWTS, KWTDIS, and KWYANTH, they don’t roll off the tongue very easy. The first one is know what you want to say, which is right, you really have to spend enough time in the data that you’re working with, to know what the story is. And then the second one is know what you the data is saying, right? So not not just kind of what is the story? What’s the framework for what’s going on? But what is the data actually saying, Not what do you wish it was saying? But what is the data actually saying. Big difference there. Yeah cannot, you know, it’s very easy to misrepresent data. And I think that that’s, you know, those two points together, know what you’re trying to say, know what the data is saying. And then the third one, I think, is the most important, personally, when I’m thinking about data storytelling, which is know what your audience needs to hear, which is not just what is the information you’re trying to convey to the audience, but what is the context? What and I think a lot of the times when you run into a problem where you’re trying to communicate something, or you’re trying to break down a really complex set of data or complex idea into something that’s easily communicable, and really easily digestible, is that third piece, which is know what your audience needs to hear, which might be, what are the acronyms that you’re used to? Or what are the terms that you use all the time, because it’s part of your data analysis, but isn’t generally understood. Or it’s how do you need to focus the data on what your audience cares about, right. And when you can make the data related to something that the audience cares about, then they will remember it better, and they will care about it more. And so when you’re trying to break down a big idea, you know, a great example of this is when all of the like COVID charts started coming out, if there’s a chart, or if there’s a diagram, where you can filter it for your home state or your home country, that immediately means more to you. Right? You are more invested, you care about it more. So I think when you’re looking at a big data picture, and maybe it feels overwhelming, those the three things that I come back to a lot is, what do you want to say? What is the data saying? And what does your audience need to hear?
Marty Molloy:
I, That’s awesome. I could honestly listen to you talk all day. And I wouldn’t ever say this before I met you like oh god data, more data data analysts. That sounds so boring. No, you, you have so many different dynamics to what you’re talking about in terms of, you’re a storyteller, you’re a teacher, you are, you know, speaking truth to power, sometimes it’s true, they want to hear maybe they don’t want to hear but you’re, you’re being a steward of that data. And I think that’s really, that’s really, really powerful stuff. So, um, I, you know, I started this conversation by saying that you’re someone who just improves the community that that she is a part of, and I’m, I’m interested in moving a little bit away from data and thinking about, you’re far away. You’re, we’re based in most of us, many of us, not all of us are based on the East Coast. You’re out in the Midwest. And so you’re remote, but yet you’ve fostered a sense of community, at least you’ve you’ve certainly contributed to our community. I’m assuming you get some of that back your way. How have you found in terms of participating in building your own community virtually, so that it’s a good work experience for yourself. Yeah, well, I think I did have a little bit of a cheat a cheat step in the door already. Because the reason I found Tamman and was through one of my dearest friends,
Emma Barker:
Without a doubt also a community builder herself. Extraordinare. So thank you. Yeah. So I think that that helped, you know that I already came in knowing someone and having a, you know, a buddy to lean on. And I think that that can be in any company just right. So the first step is finding a person that you connect with, and using, you know, that stepping stone to get you involved. And I think the other thing was, you know, I knew when I was taking the position that I was going to be remote, and I wasn’t going to be meeting people in person, for a long time, or ever, who knows. And so I was really intentional about finding all of the little ways to, you know, show up and go to things, try out different, you know, if there’s a meeting that you’re invited to, that you don’t really need to be part of getting in just even if I have nothing to contribute, just listening and getting to know people. And at Tamman, we have a couple optional meetings, just called Coffee Break, where people just show up and chat. And so doing those kinds of things. And you know, even if it’s a day where I’m like, I have a lot of work, just taking that 15 minutes just to chat and learn about like, Oh, who’s playing what video game or whose pets have done something funny lately, just the kind of stuff that, you know, you’re not going to get when you’re in a really, you know, a focus work meeting where you’re trying to get stuff done. So I think…
Marty Molloy:
That’s, that’s absolutely wonderful. So let me just end with this. Is there something that you want to put out there in the world? It can be anything at all in terms of work related or non related? Is there something that you wish I asked you so that you can put it out in that world? Oh, our world?
Emma Barker:
Well, one thing that I was thinking about before that I really, I was wondering if it would come up, and I think is really important is that I think, I wish that every school or every I don’t know if it’s school, or if it’s college, really had some section of focusing on kind of the data literacy and critical thinking aspect, right? I’m not talking learning algebra, or trigonometry. I’m talking like, How can I look at, you know, some news article or statistic that’s floating around and really understand what it means. And I think that a way that that can be tricky is, you know, if you think about data can be we mentioned this earlier, data can be misrepresented so easily. And it can be done intentionally or unintentionally. And I think having a little bit of training on critical thinking to think about, oh, there’s been a 70% increase in whatever bad thing the media is gonna scare us about today. Yes, I might need to start over my smoke alarm is doing a test. Oh, I didn’t even hear it until just then. It’s hilarious. I heard it in the other rooms here, coming here. Back up? Yes. So I think that a way that this shows up is the ability to think critically about information that were given, often, you know, in the media, or you see something, a number gets passed around. And I think a place that that can be really easy to misinterpret is things like, oh, there’s been a 70% increase in something bad, right? Yep. And that could be a really big effect, or if it’s a very small sample size, right, maybe, maybe last year, there. I don’t have my numbers right off the top of my head, but say there were four last year, and there’s five next year. That’s a 25%. Ooh, that’s scary. Yeah, it’s one more, right. So I think that having a little bit of that kind of critical eye and critical thinking and data literacy could just be extremely helpful across the board. So that’s, you know, if, if you’re interested, I think that that’s a great thing to just try to dig into a little bit and bring kind of that, that questioning curiosity, thoughtfulness to think, you know, when data is presented to you and really dig in and think a little bit behind what’s behind the curtain? To understand it.
Marty Molloy:
And first, I think, checking your own emotion, right. I mean, this happens to me all the time, right? I’m just, I’m on Google News or something at the end of the night, and I see something and it’s immediate, like, whoa, you know, that’s what they want, right? There’s, but then it’s like, well, wait a second. Let me just check myself first. And I think the other side of this is teaching kids especially although adults for have not learned it. But let’s hope for the younger generation, they’re better than us. I know with my own children and having worked in schools previously, they don’t dig. It’s, I’m going to do a Google search, whatever the first thing that comes up is, I’m going to take that at face value. And they’ve been taught that Wikipedia is bad, even though I fundamentally disagree with that. But, uh, you know, so just, oh, it’s not Wikipedia. Anything else? I’ll take a look at that. And my son and I were just talking about this. He’s doing a research paper on the black death. And I said, Well, you know, that the Black Death, all these numbers that you’re talking about in terms of overall deaths that occurred in the Middle Ages, there was actually three different types of the plague. And he said, No, I didn’t see any of that. Well, how deep well, it wasn’t in the Google search. Well, no, I mean, yes. Just because, uh huh. You know, but it’s exactly the point like, be curious about this, get dig a little bit deeper, go past those first few hits. And whoever has the best SEO and kind of look and see what’s behind behind some of that. I’m also struck by I’m a big are you a soccer fan? No,
Emma Barker:
I mean, I, I’ll watch it. But no.
Marty Molloy:
The, soccer has this thing where players can move between teams across countries and things like that. And the British press especially is notorious at being like, any rumor, they will write a whole article about it. And I laugh it up. I mean, what I’ve learned that, you know, there are certain sources that’s like, Oh, I’m still gonna lap it up. But if ESPN or some other sort of reputable source, puts it in there, then it’s like, okay, well, this is actually has some validity to it. But it you know, in that sort of less important realm, I still read every stupid rumor that might exist, just because it’s fun. Well, Emma, thank you so much for spending a little bit of time with us, I really appreciate you, I appreciate you, the work that you do the skill with which you do it, and all the community that you build at Tamman and we wouldn’t have as good a Tamman without you. And I just, you make better every single day with every contribution that you make. So I really do genuinely appreciate that. If you want to know more, if you want to listen to some of our back episodes of Article 19. You can check us out wherever you get your podcasts, if you want to engage with Tamman, any of our thought leadership things that we’re writing, doing, showing, by all means you can check us out on our website at WWW dot Tamman Inc. dot com, or on any of our social media platforms at Tamman Inc. and we will talk to you soon. Bye
Emma Barker:
Bye.
Marty Molloy:
Well, thank you your dog is beautiful by the way.
Emma Barker:
I was like he’s getting up and moving. Aussie in and out of shots.
Marty Molloy:
Gorgeous black sheen. Yeah. Very good. How old is your puppy?
Emma Barker:
He this one is seven. Oh, he’s seven. The puppy is in the other room and luckily was not too bad. Just over a year.
Marty Molloy:
That’s awesome. What kind of dogs that looks like sort of chocolate lab kind of thing.
Emma Barker:
Yeah, he’s a lab pit mix. She’s also a rescue. She’s like an Australian Shepherd. Australian cattle dog mix. Lots of energy.
Marty Molloy:
Yeah, lots of energy. That’s awesome. Yeah, my cat attacked me midway through our conversations. Oh, like back you couldn’t see him and I could not talk. Um, they but they do that like I get on camera or start recording or something and they start anyway. Yeah,
Emma Barker:
if I have my door open and I start talking then the cat will come in and like
Marty Molloy:
Ooh what’s going on?
Up Next
Thoughts
Some Thoughts on Not Getting the Job